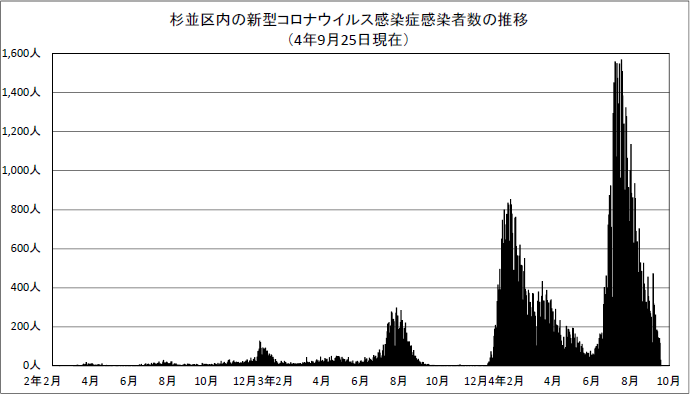
Due to the limited number of people subject to notification of the outbreak of the new coronavirus infectious disease, the items listed for the infection status have been changed since September 26, 2014.
Please check the infection status after September 26, 2014 at the following link.
The number of new coronavirus infected people in the city
|
From August 15th |
August 22nd |
From August 29th |
From September 5th |
From September 12th |
From September 19th |
Cumulative |
|
|---|---|---|---|---|---|---|---|
|
Ward infected person |
5,662 people |
4,423 people |
3,188 people |
2,363 people |
2,060 people |
1,672 people |
120,684 people |
|
Ward discharged persons, etc. |
6,276 people |
5,656 people |
4,389 people |
3,613 people |
2,696 people |
2,024 people |
119,422 people |
|
metropolitan infected |
180,266 people |
136,482 people |
88,570 people |
67,968 people |
58,661 people |
41,960 people |
3,141,771 people |
(note)
- The number of infected people is "the number of infected Suginami residents" until January 3, 2013, and "the number of people reported by the Suginami Public Health Center" after January 4.
- “Ward discharged patients, etc.” includes those who have completed home or accommodation treatment.
- Information such as age, gender, and outbreak area in the city will not be uniformly announced.
- Numbers may be retroactively revised.
-
The number of new coronavirus infected people in Suginami Ward (daily) (PDF 351.7KB)

Page 2 from June 15, 2nd year, Page 3 from October 5th, Page 4 from January 25th, 3rd year, Page 5 from May 17th, Page 6 from September 13th, 4 January 10th, 2010, page 7, May 9th, page 8, September 5th, page 9. From the week of December 7, 2020, the weekly infection route unknown rate is also posted.

Trend of infected people in the ward
[By probable cause of infection] Number of infected people
-
Trends in people infected with the new coronavirus in Suginami Ward [by probable cause of infection] Number of infected people (every week) (PDF 141.9KB)

Estimated number of infected people by cause of infection from the week of January 18, 2018. Page 2 from the week of October 11, 3rd year, page 3 from the week of July 11th, 4th year.
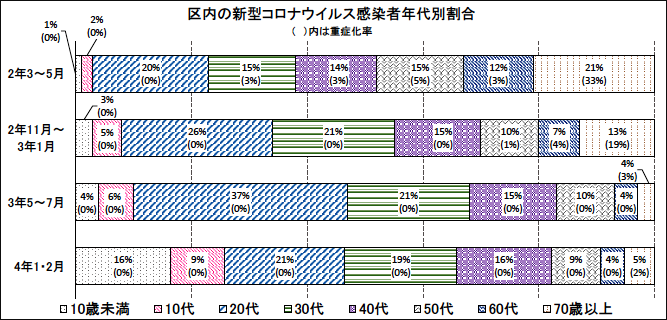
[By age group] Number of infected people, number of severe cases, number of deaths
|
age |
Number of infected people (a) |
Proportion of infected people by age group (a/A) |
Critically ill (b) |
Severity rate (b/a) |
deceased (c) |
Mortality (c/a) |
|---|---|---|---|---|---|---|
|
under 10 years old |
13,531 people |
11.2% |
0 people |
0.0% |
0 people |
0.0% |
|
10-19 years old |
11,547 people |
9.6% |
0 people |
0.0% |
0 people |
0.0% |
|
20-29 years old |
26,844 people |
22.2% |
1 person |
0.0% |
1 person |
0.0% |
|
30-39 years old |
23,122 people |
19.2% |
1 person |
0.0% |
0 people |
0.0% |
|
40-49 years old |
20,211 people |
16.7% |
3 persons |
0.0% |
2 people |
0.0% |
|
50-59 years old |
12,876 people |
10.7% |
11 people |
0.1% |
6 people |
0.0% |
|
60-69 years old |
5,829 people |
4.8% |
21 people |
0.4% |
12 people |
0.2% |
|
70-79 years old |
3,321 people |
2.8% |
51 people |
1.5% |
43 people |
1.3% |
|
80-89 years old |
2,241 people |
1.9% |
91 people |
4.1% |
86 people |
3.8% |
|
Over 90 |
1,162 people |
1.0% |
97 people |
8.3% |
95 people |
8.2% |
|
Total (A) |
120,684 people |
100.0% |
276 people |
0.2% |
245 people |
0.2% |
(note)
- "Deaths" are the number of deaths reported to the national government through the metropolitan government, regardless of the cause of death, including traffic accident deaths, etc., when a person positive for the new coronavirus infection dies.
- "Severely ill" is the number of severely ill people defined by the capital and the number of deaths identified by the ward.
-
Trends in people infected with the new coronavirus in Suginami Ward [by age] Number of infected people, number of severe cases, number of deaths (PDF 309.5KB)

Monthly number of infected people, severe cases, and deaths from February 2020 to September 25, 2014 (total and monthly figures)

others
Infected people live throughout the city.
Please see the link below for the positive rate in the city, the monitoring test by the PCR test bus, the free PCR test business station front test, the number of beds and the number of inpatients in the city.
Disclosure of infection information at medical institutions and municipal facilities in the city
- Approach to publicizing cases of infectious diseases (updated on February 28, 2012 and December 12, 2014)
- In the future, we will announce the number of new coronavirus infected people in Suginami Ward (March 27, 2020)
- Infection information at medical institutions and municipal facilities in the city (updated as needed)
Related information
Adobe Reader is required to view PDF files. If you do not have it, download it (free) from the Adobe Systems website (opens in a new window).
Inquiries about this page
Health Prevention Division, Suginami Public Health Center
5-20-1 Ogikubo, Suginami-ku, Tokyo 167-0051 Phone: 03-3391-1025 (direct) Fax: 03-3391-1927
